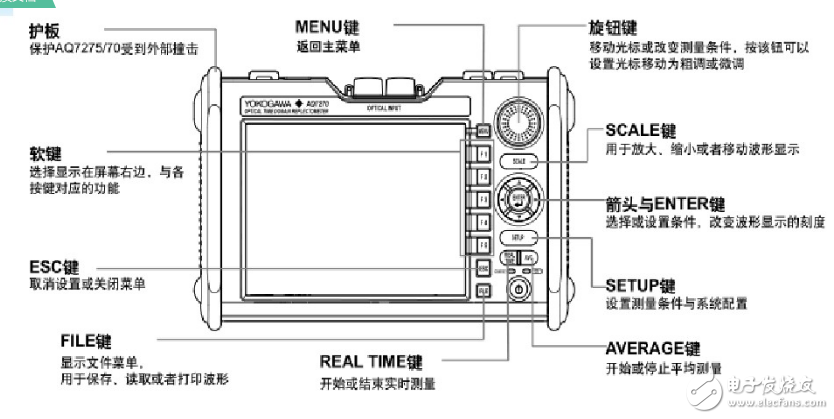
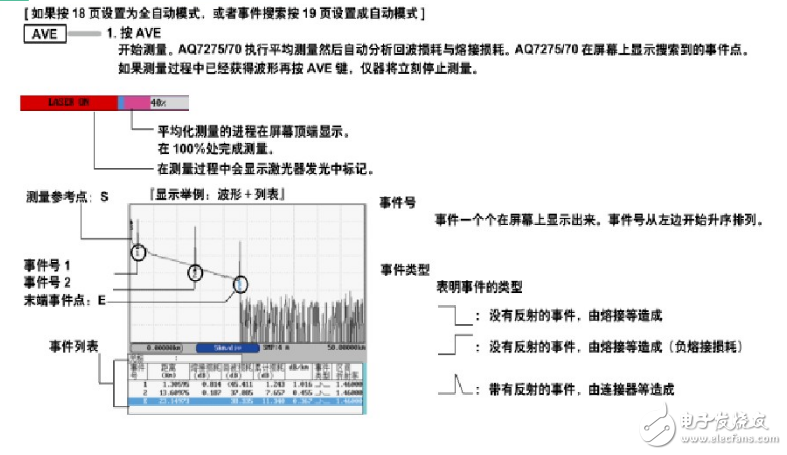
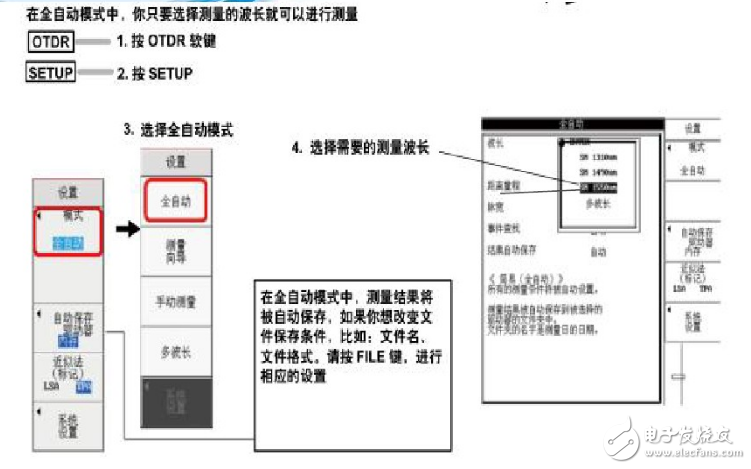
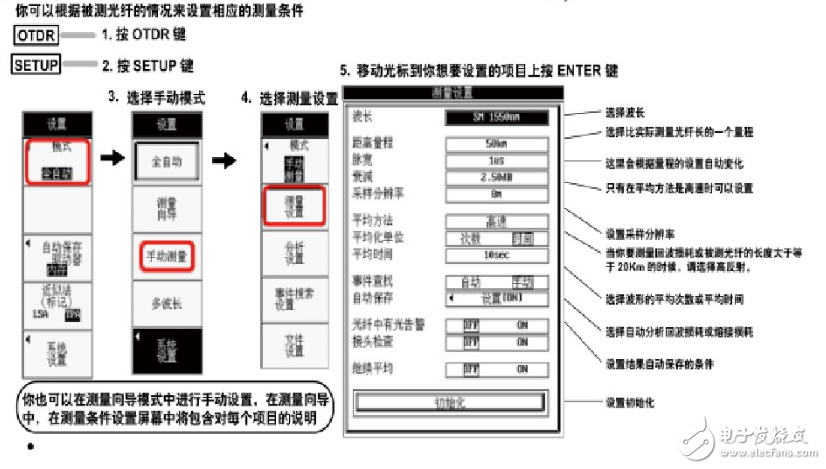
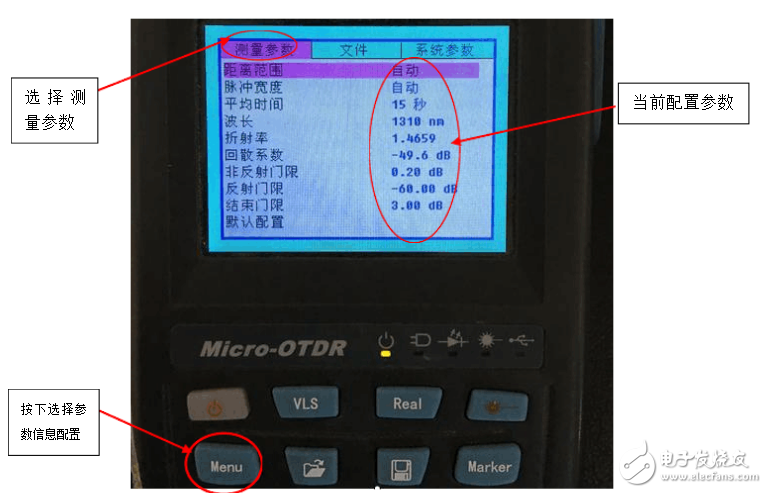
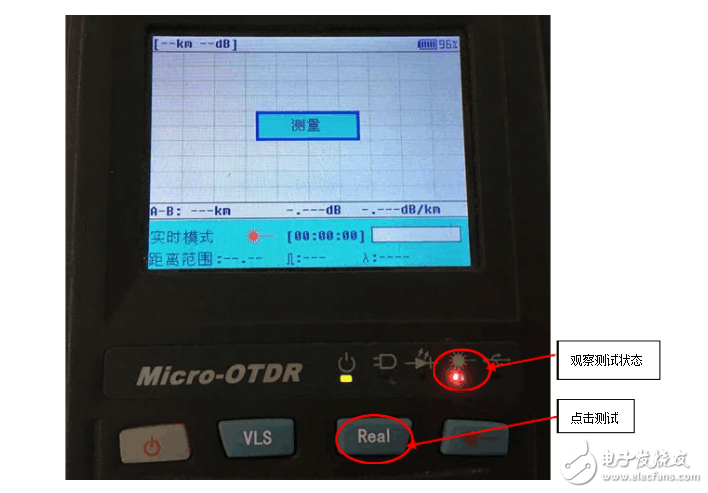
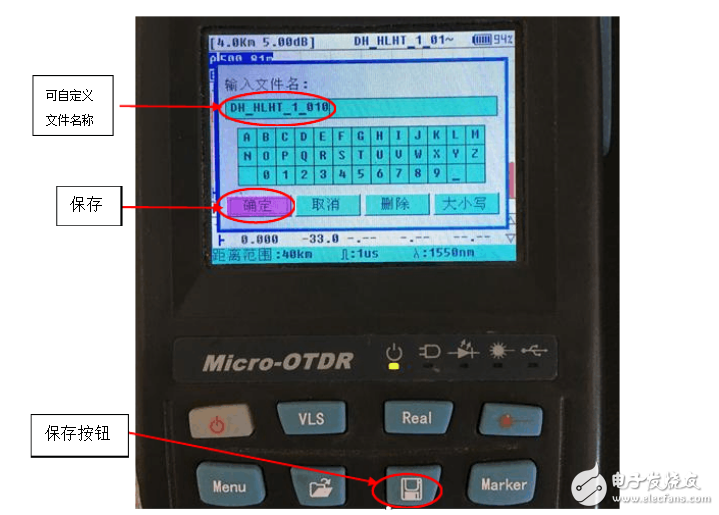
Fiber optic cable testing is an important technical means for cable construction, maintenance, and repair. The use of OTDR (optical time domain reflectometer) for on-site monitoring of fiber optic connections and connection loss measurement and evaluation is currently the most effective method. This method is intuitive, reliable, and prints the fiber backscatter signal curve. In addition, the actual transmission distance from the intra-office to each joint point can be accurately measured at the same time of monitoring. It is necessary to accurately find faults and effectively handle faults during maintenance. At the same time, maintenance personnel are required to master the instrument performance, skilled operation skills, and accurately judge the characteristics of the signal curve. The OTDR test is performed by transmitting a light pulse into the fiber and then receiving the returned information at the OTDR port. When a light pulse is transmitted within an optical fiber, it can scatter and reflect due to the nature of the fiber itself, connectors, joints, bends, or other similar events. Part of the scattering and reflection will be returned to the OTDR. The useful information returned is measured by the OTDR's detectors, which serve as time or curve segments at different locations within the fiber. The distance can be calculated from the time it takes to transmit the signal to the return signal, and then determine the speed of the light in the glass material. d=(c&TImes;t)/2(IOR) In this formula, c is the speed of light in vacuum, and t is the total time from the time the signal is transmitted to the time it is received (two-way) (the distance between two values ​​divided by 2 is the distance of one-way). Since light is slower in glass than in vacuum, in order to accurately measure the distance, the fiber being measured must indicate the index of refraction (IOR). IOR is indicated by the fiber manufacturer. OTDR uses Rayleigh scattering and Fresnel reflection to characterize the fiber. Rayleigh scattering is due to the irregular scattering of optical signals along the fiber. The OTDR measures a portion of the scattered light back to the OTDR port. These backscattered signals indicate the degree of attenuation (loss/distance) caused by the fiber. The resulting trajectory is a downward curve that illustrates the decreasing power of backscattering due to the loss of both transmitted and backscattered signals after a certain distance of transmission. Fresnel reflections are discrete reflections that are caused by individual points in the entire fiber that are caused by factors that cause a change in the inverse coefficient, such as the gap between glass and air. At these points, there is a strong backscattered light that is reflected back. Therefore, OTDR uses information from Fresnel reflections to locate connection points, fiber terminations or breakpoints. The OTDR works like a radar. It first sends a signal to the fiber and then observes what information is returned from a certain point. This process is repeated, and the results are averaged and displayed in the form of a trajectory that depicts the strength of the signal (or the state of the fiber) throughout the fiber. Test distance: Since the refractive index of the fiber is basically unchanged after the fiber is manufactured, the propagation speed of the light in the fiber is constant, so the test distance and time are consistent. In fact, the test distance is the propagation speed of the light in the fiber multiplied by the propagation. Time, the selection of the test distance is the selection of the start and end time of the test sample. Selecting the appropriate test distance during measurement can generate a comprehensive trajectory map, which is very helpful for the analysis of the characteristics of the effective fiber. Usually, according to experience, it is most suitable to select 1.5-2 times the length of the entire optical path. Pulse width: It can be expressed in time or length. When the optical power is constant, the pulse width directly affects the energy of the light. The longer the light pulse, the greater the energy of the light. At the same time, the size of the pulse width also directly affects the size of the test dead zone, which determines the shortest distance between two distinguishable events, namely resolution. Obviously, the smaller the pulse width, the higher the resolution, and the larger the pulse width, the longer the test distance. The refractive index is the actual refractive index of the fiber to be tested. This value is given by the manufacturer of the fiber to be tested. The refractive index of the single-mode quartz fiber is between 1.4 and 1.6. The more precise the refractive index is, the more helpful it is to improve the accuracy of the measurement distance. This problem also has practical guiding significance for configuring optical routing. In fact, when configuring optical routing, fibers with the same or similar refractive index should be selected for configuration, and fiber cores with different refractive indices should be minimized to form a non-single refractive index. The light path. The test wavelength refers to the wavelength of the laser emitted by the OTDR laser. In the long-distance test, due to the large attenuation of 1310 nm, the laser pulse emitted by the laser will become very weak at the end of the fiber to be tested, which is greatly affected by noise. The trajectory map is not ideal, and 1550nm should be used as the test wavelength. Therefore, it is suitable to select 1550nm as the test wavelength in the long-distance test, and 1310nm in the ordinary short-distance test. Average: A parameter that is set to form a good display pattern in the OTDR and to display the status of the fiber dynamically or non-dynamically according to the user's needs. Due to the influence of noise in the test, the Rayleigh scattering power at a certain point in the fiber is a stochastic process. To determine the general situation of the point and reduce the influence of the random noise inherent to the receiver, it is required to be tested at a certain period of time. average value. Set this value as needed. If you need to know the fiber in real time, you need to set the time to real time. Optical time domain reflectometer test is divided into automatic and manual mode First clean the test side pigtail, insert the pigtail vertical meter test jack, and fully connect the U-shaped part of the pigtail protrusion to the U-shaped part of the test socket, and screw it properly. Before the line is repaired or cut, the fiber to be tested should be connected to the OTDR before the connected station maintenance unit removes the corresponding pigtail on the ODF frame to avoid damage to the disc. a, wavelength selection: select the wavelength required for testing, there are 1310nm, 1550nm two wavelengths to choose; b. Distance setting: firstly test the optical fiber in automatic mode, and then set the test distance according to the length of the test fiber, which is usually 1.5 times of the actual distance, mainly to avoid the occurrence of false reflection peaks and influence judgment; c. Pulse width setting: The pulse width of the instrument can be selected as follows: 10 ns, 30 ns, 100 ns, 300 ns, 1 μs, 10 μs, etc. The smaller the pulse width, the shorter the sampling distance, the more accurate the test, otherwise the more the test distance Long, the accuracy is relatively small. According to experience, the parameters of 100ns and below are generally selected below 10KM, and the parameters of 100ns and above are selected above 10KM; d, sampling time: the longer the sampling time of the instrument, the smoother the curve, the more accurate the test; e, refractive index setting: according to the requirements of each transmission line; f. Event threshold setting: It means that the attenuation of the connection point or loss point of the fiber is preset in the test. When there is an event exceeding the threshold, the instrument will automatically analyze the positioning. a, the curve is rough, no smooth curve Cause 1: The test instrument socket is damaged (changing the socket) Cause 2: The test pigtail is not properly connected (reconnected) Reason 3: Test the pigtail problem (replace the pigtail) Cause 2: Line terminal problem (re-connect, can be inserted into the fake fiber for testing when performing terminal loss measurement) b, the curve is smooth, 1 The horizontal axis of the signal curve is the distance (KM), the vertical axis is the loss (dB), the front end is the initial reflection area (blind area), which is about 0.1KM, the middle is the signal curve, which is a step-down curve, and the end is the terminal reflection area. After the signal curve is exceeded, it is a rough part (ie, the fiber cut-off point. 2 As shown in the figure, the common joint or bend is a descending step, the movable joint is a reflection peak (the false reflection peak is introduced later), the fracture is the reflection peak of the larger step, and the pigtail end is the end reflection peak. . 3 When there is active connection in the test curve or the test range is large, more than 2 false reflection peaks will appear, and it can be judged whether it is a false reflection peak according to the distance of the reflection peak. Causes of false reflection peaks It is because the light is reflected in the shorter fiber, reaching the end B of the fiber, the reflected light power is still strong, the first movable joint A is encountered in the return stroke, and some of the light is reflected back to B, and this part of the light reaches point B. Later, it is reflected back to the OTDR again at point B, so that a reflection phenomenon appears in the noise region in the trajectory map formed by the OTDR. 4 When the test curve terminal is a normal reflection peak, it indicates that the opposite end is a pigtail connection (machine room station), as shown in Figure A; When there is no reflection peak at the end of the test curve, it is a curve that is straight and downward. It indicates that the opposite end is the terminal that has not been processed (that is, the break point), that is, the fault point, as shown in Figure B. c, joint loss analysis, 1Automatic analysis: Through the event threshold setting, the automatic list reading of the threshold event is exceeded; 2 manual analysis: using the 5-point method (or 4-point method), the first 2 points are set and the smooth curve of the joint forward curve, the third point is set on the joint point step, the fourth point is set at the beginning of the step below, the first 5 points are set at the smooth end of the joint to the curve, and the reading from the meter is the joint loss; 3 joint loss using the two-way averaging method, that is, the sum of joint loss at both ends is tested. d, loopback joint loss analysis, 1 During the construction process, in order to timely monitor the joint loss and save man-hours, it is often necessary to carry out the fiber loop connection at the opposite end of the optical cable connection, that is, the light sequence 1# is connected to 2#, 3#-connected 4#, and so on. The end can monitor the bidirectional loss of the intermediate joint; 2 Taking 1# and 2# fiber as an example, the loss at the connection point of the local end test is 1# fiber forward joint loss, and the loss of the connection point after the loopback point is 2# fiber forward joint loss, pay attention to judge the forward and reverse The continuation points are equidistant from the loopback point. e, fiber attenuation analysis, Set the A mark to the smooth end of the curve, and set the B mark to the smooth end of the curve. Read the attenuation value between the AB marks, which is the transmission attenuation of the fiber. In actual operation, the light source power meter is more accurate. ) e, curve storage, The OTDR has a storage function, and its operation is similar to the computer operation function. It can store more than 1000 curves for maintenance analysis. Ebike Charger,Electric Motorcycles Chargers,E-Motorcycle High Power Charger,Electric Motorcycles Fast Charger HuiZhou Superpower Technology Co.,Ltd. , https://www.spchargers.com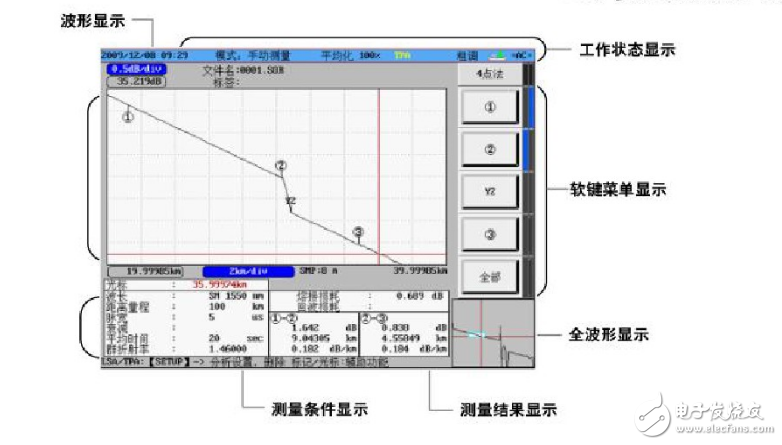
How OTDR works: